
Connected Papers Review: Free Visual Paper Graphs
What Connected Papers is
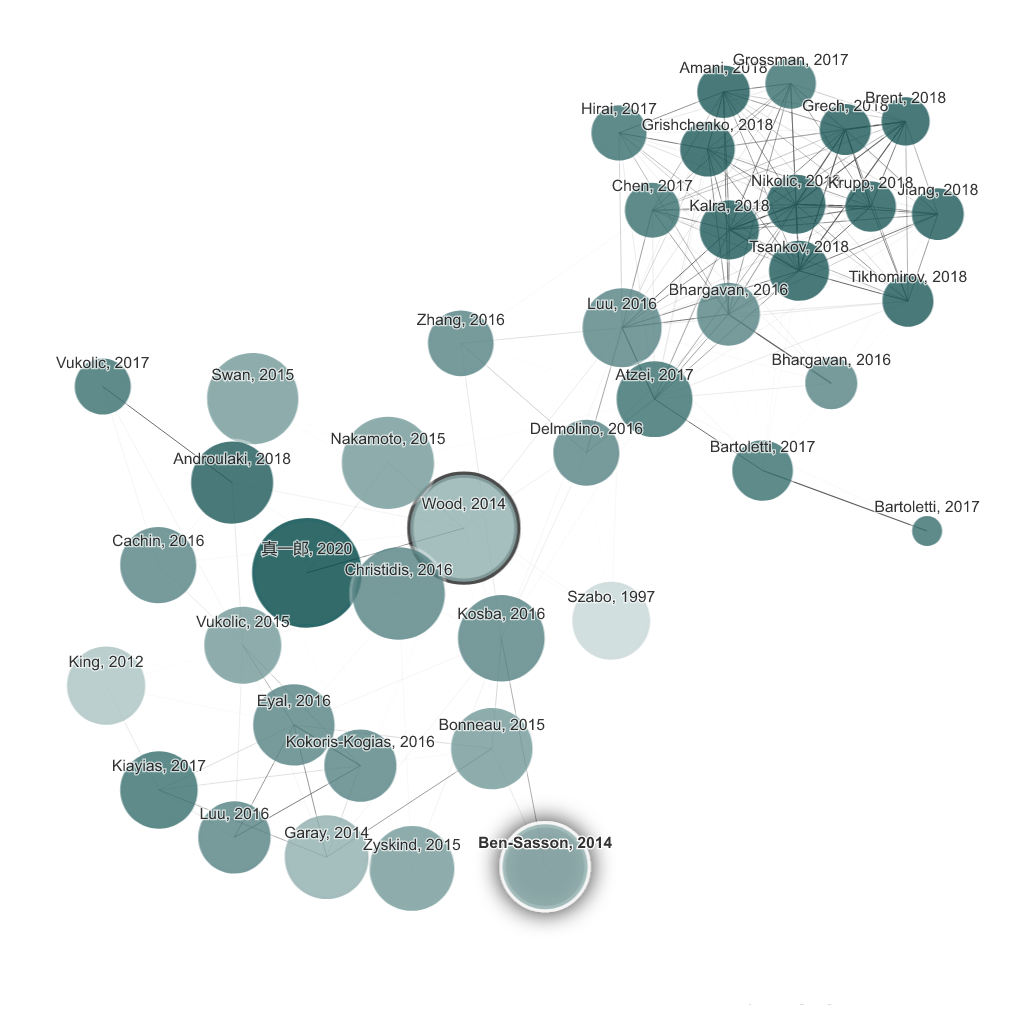
Connected Papers (at connectedpapers.com) is a visual literature-discovery tool with a beautifully simple premise: enter one paper you know is relevant, and it generates a graph of related work arranged by similarity and citation relationships. Prior works that laid the foundations appear on one side, derivative works that built on the seed on the other, and the most central papers cluster in the middle. In about ten seconds you get a visual literature review of a topic.
The graphs are built on data from Semantic Scholar, and the interface is famously intuitive — node size reflects citation count, color can encode recency, and clicking any node reveals the abstract. It has become a staple recommendation in “how to do a literature review” guides precisely because it makes the invisible structure of a field visible.
What’s actually free
Free plan: 5 graphs per month — each graph is a full interactive visualization from a seed paper of your choice, which is enough for occasional deep dives into new topics. Paid plans for unlimited graphing start at a few dollars per month (directories cite roughly $3–5/month). Free-tier details checked October 2026; confirm current limits on connectedpapers.com since the free allowance has been adjusted before.
Key features
- Seed-paper graphs: one paper in, a full related-work landscape out.
- Prior and derivative views: separate lists of foundational works and papers that built on the seed.
- Visual encoding: node size by citations, color by year — spot influential and recent work instantly.
- Abstract previews: click any node to read the abstract without leaving the graph.
- Save and share: keep graphs and share them with collaborators.
- List view: the same results as a sortable paper list when you prefer text.
Pros and cons
Pros
- Fastest way to grasp a new field’s structure — genuinely revelatory first use
- Gorgeous, intuitive interface with zero learning curve
- Free tier is usable for real work, not just a teaser
- Built on Semantic Scholar’s massive, high-quality citation data
Cons
- Only 5 free graphs per month — active researchers will hit the cap
- Discovery only: no AI summaries, PDF analysis, or synthesis
- Quality depends on Semantic Scholar’s coverage of your field
- Single-seed view can miss disconnected but relevant clusters
Who it’s best for
Connected Papers is best for researchers and students facing an unfamiliar topic — the classic “I need to get up to speed on X by Friday” situation. It is also excellent for supervisors and journalists who need a quick map of who matters in a field. For ongoing, collection-based discovery, pair it with ResearchRabbit.
FAQ
Is Connected Papers free?
Yes — the free plan includes 5 graphs per month. Unlimited graphing requires a paid plan starting at a few dollars per month.
How is Connected Papers different from ResearchRabbit?
Connected Papers gives you one beautiful graph from one seed paper — ideal for a quick overview. ResearchRabbit builds persistent collections with updating recommendations, Zotero sync, and author alerts for ongoing discovery.
Where does Connected Papers get its data?
Its graphs are built on Semantic Scholar’s academic database, which covers 200 million-plus papers and their citation relationships.
Can I export or share my graphs?
Yes — graphs can be saved to your account and shared with collaborators via link.
Do I need an account?
You can explore the concept without one, but saving graphs and tracking your monthly free allowance requires a free account.
How accurate are Connected Papers graphs?
Graphs reflect citation and similarity relationships in Semantic Scholar’s data, which is high quality but not perfect — very new papers may have thin citation links, and interdisciplinary connections can be underrepresented. Treat the graph as a map for exploration, then read the papers themselves.
Can I use Connected Papers for a systematic review?
It is a useful scoping aid for finding seed-adjacent literature, but it is not a systematic search method on its own. Formal reviews still need documented database searches; use Connected Papers to make sure your search terms are not missing obvious clusters.
Bottom line
Based on specs, pricing, and published reviews, Connected Papers is the single most impressive five-minutes-free experience in research discovery: one paper becomes a map of a field. The monthly cap means it is a scalpel, not a daily driver — but every researcher should know it exists.
Free-tier details checked October 2026. Based on published specs and pricing; not hands-on testing.