
Quick verdict
Visualizer Review 2026: The AI Chart Builder That Turns a Sentence Into a Publish-Ready Graph
Visualizer — listed on WordPress.org as “Visualizer: Tables and Charts Manager” — creates interactive charts and tables for WordPress posts and pages, and its newest headline feature is a built-in AI chart builder that turns a plain-language description into a finished chart. The free plugin is on WordPress.org (version 4.0.10, updated October 2026, 20,000+ active installs, rated 4.4 out of 5 from 225 ratings) from ThemeIsle, the team behind the Neve theme. Pro runs from $99/year introductory for one site and unlocks all 15 chart types plus every data-import route — but renewals jump to the full $199/year, a detail the pricing table does not shout about.
What it is
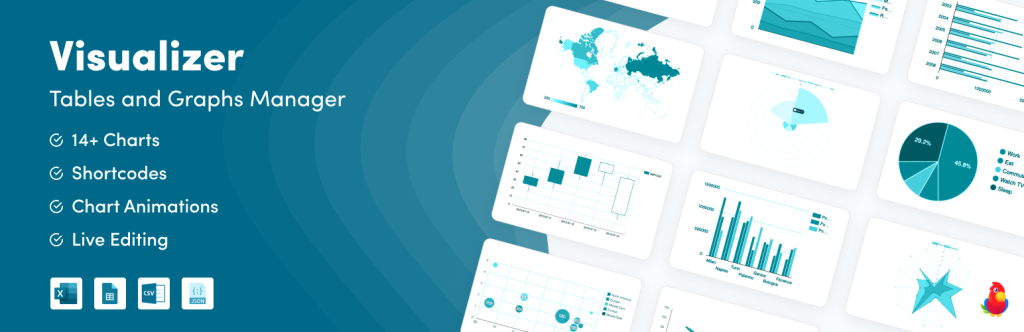
Visualizer is a charts-and-tables plugin by ThemeIsle. Under the hood it draws on the Google Visualization API, DataTables.net and ChartJS, so charts are responsive, animated HTML/SVG rather than flat images, and it can also present the same data as a sortable, paginated table. The current release adds an AI chart builder powered by D3.js: describe the chart you need in everyday language and Visualizer builds a customizable, ready-to-embed chart in seconds, with no API key and no setup. The 4.0.9 changelog also added AI agent support, letting assistants read and change charts.
The free and paid split is about data and chart types, not the AI. Free covers manual data entry through the built-in editor and the basic chart types — line, pie, bar and table among them. Pro expands the library to 15 chart types and opens every import route: CSV, XLSX, JSON and Google Sheets files, live URLs, external databases, WordPress post data and WooCommerce reports.
Key features
- AI chart generation, free. Type a plain-language description and the built-in builder, powered by D3.js, produces a publish-ready chart instantly — no API key, account or configuration required.
- 15 chart types on Pro. Free covers the essentials such as line, pie, bar and table; Pro adds 11+ premium types including geo, gauge, combo, scatter and area charts.
- Every data route on Pro. Import from CSV, XLSX, JSON, Google Sheets, a live URL, an external database, WordPress itself or WooCommerce reports — or reuse data from an existing chart.
- Live, synced charts. Pro can refresh a chart from its source on a schedule from minutes to days, with tooltips and download, copy and export actions for visitors.
Pricing
The core plugin is free on WordPress.org, including the AI chart builder and manual data entry. Visualizer Pro is priced by site count on ThemeIsle’s own upgrade page: Personal $99/year for 1 site, Plus $199/year for 3 sites, and Infinite $399/year for unlimited sites. All three tiers include all 15 chart types and the full set of data-import options, and a 30-day money-back guarantee applies.
What the pricing page doesn’t make obvious: those prices are introductory. The same pricing table shows struck-through full prices — $199, $399 and $799 — and its footnote states “Special introductory pricing, all renewals are at full price,” so year two costs roughly double year one. A second tier trap sits in ThemeIsle’s own documentation: periodic synchronization is Plus and Infinite only, and Personal supports only one-time manual imports from an online file — a Personal chart never refreshes itself. Custom permissions and the on-page editor are likewise Plus-and-above.
Who it’s for
- Bloggers and publishers with data stories — turn a sentence and a handful of numbers into an interactive in-article chart, free, instead of screenshotting a spreadsheet.
- Educators and report writers — responsive charts and tables that hold up on phones, with manual entry for small datasets and Pro imports when the data grows.
- WooCommerce and dashboard-style sites (Pro) — build charts from store reports or a database and let scheduled sync keep them current without republishing the page.
What to watch out for
- Renewals are at full price. Budget $199, $399 or $799 for year two, not the introductory $99, $199 or $399 shown largest on the pricing page.
- Almost every data source is Pro. In the free version your data goes in manually; spreadsheet, Sheets, URL, database and WooCommerce imports all require a licence, and automatic recurring sync requires Plus or Infinite.
- The free/Pro split has moved before. Long-time users’ WordPress.org reviews from 2024 complain that chart types they once used free moved behind the licence prompt, forcing rollbacks — check that the exact chart type you need is in your tier before building content around it.
- A middling rating for its size. At 4.4 out of 5 from 225 ratings, Visualizer scores below most plugins we review at 20,000+ installs; several recent reviews praise the charts but criticise how aggressively the free version pushes upgrades.
- Research-based review. This review is based on Visualizer’s WordPress.org listing and changelog, ThemeIsle’s product and upgrade pages and its documentation; we have not run it on a production site ourselves.
Pros
- The AI chart builder is genuinely free — a sentence becomes a chart with no API key, account or setup.
- Established vendor and codebase: ThemeIsle, 20,000+ active installs, 300,000+ charts created, updated in October 2026.
- Charts are interactive and responsive (Google Visualization, ChartJS, D3.js), and the same data can render as a sortable table.
Cons
- Introductory pricing doubles at renewal — $99/year becomes $199/year on Personal.
- Spreadsheet, database and live-feed imports are all Pro, and recurring sync starts at Plus ($199/year introductory).
- WordPress.org reviewers report free features migrating into Pro in past versions.
Frequently asked questions
Is Visualizer free?
Yes. The WordPress.org plugin is free with manual data entry, the basic chart types and the AI chart builder, which needs no API key. Pro — $99/year introductory for 1 site, $199/year for 3 sites, $399/year for unlimited sites — adds all 15 chart types and every data-import option. Renewals are charged at the full prices of $199, $399 and $799 per year.
How does the AI chart builder work?
Describe the chart you need in plain language and Visualizer’s built-in builder, powered by D3.js, generates a customizable chart you can embed in seconds. It works in the free version with no API key or setup, and you can keep editing the chart’s data, colours and settings afterwards.
Can Visualizer keep a chart updated automatically?
Yes, on Pro — but recurring scheduled synchronization is limited to the Plus and Infinite plans. The Personal plan can import from an online file only as a one-time manual import, per ThemeIsle’s documentation, so its charts do not refresh themselves.